25 April 2025 Updates
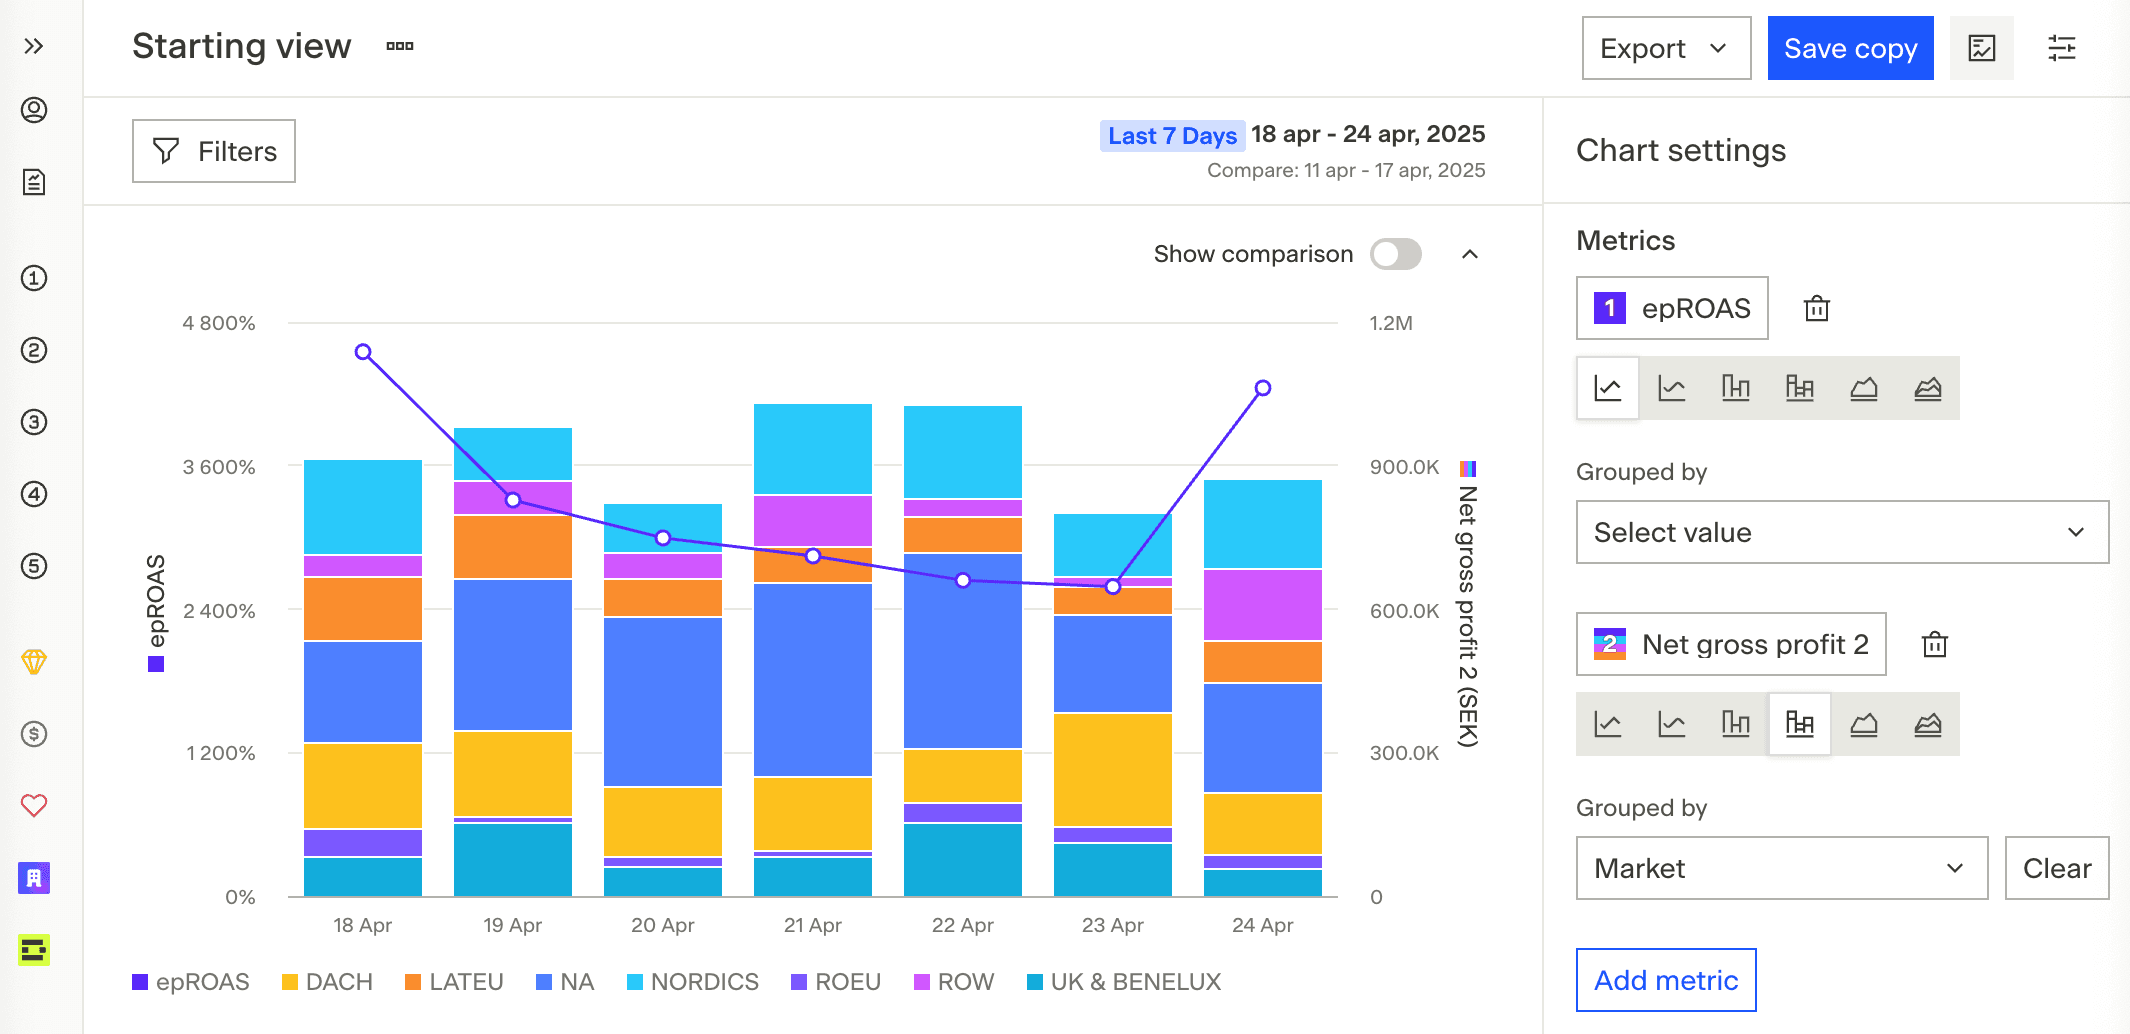
Chart improvements is now live! Some of the highlights include:
Group chart per metric, create visualizations combining metrics and dimensions for deeper insights.
Select what metric is shown on each y-axis making it easier to compare metrics at different scales.
Improved legend, easily toggle what group is shown.
Updated tooltip design for increased readability.